Kaplan Meier
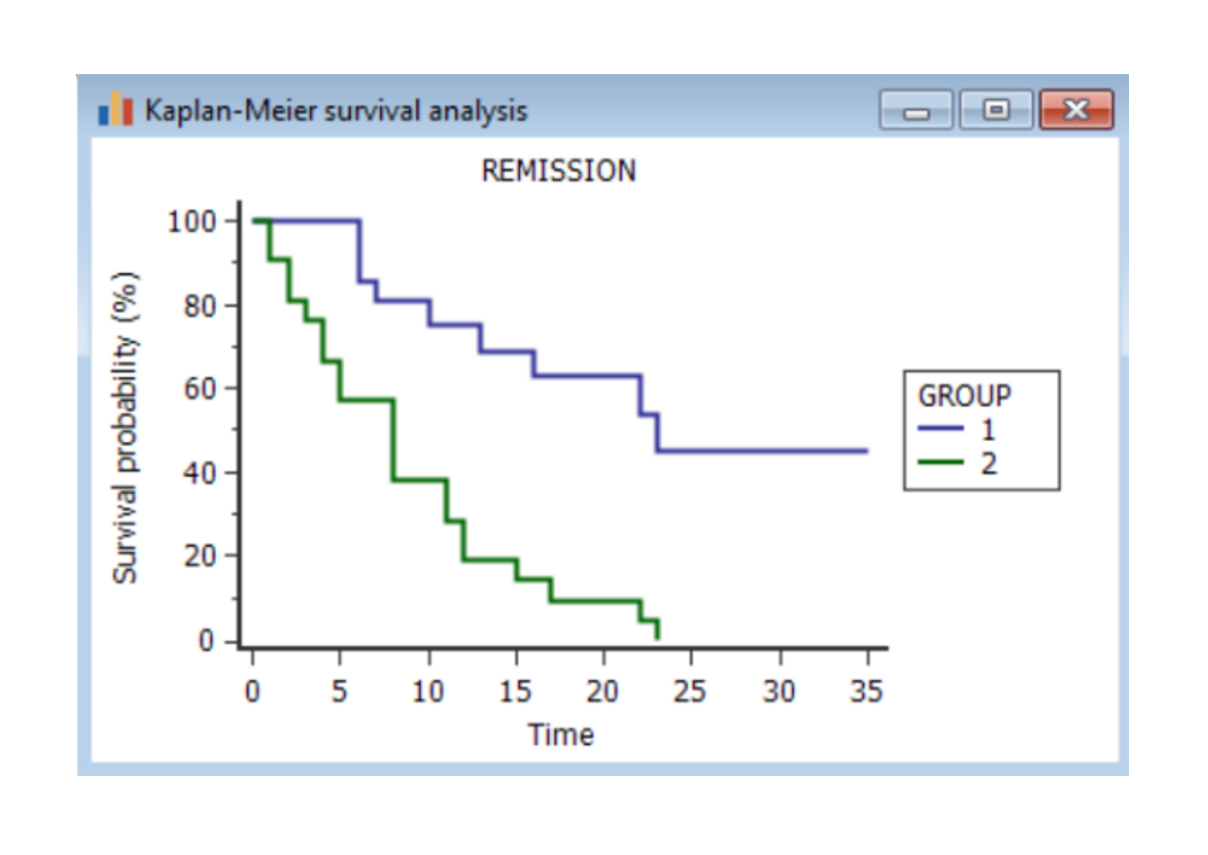
Often, clinical studies are done over a long period of time (for example 5 years). During this time, for each patient involved, there are 3 possible outcomes - they either make it to the end of the study (so are said to have survived); they pass away at some point during the study (in which case we record how long into the study this happened); they are still alive but haven't finished the study. In the final case, say a patient has been alive for 3 years (in a 5 year study). It would be wrong to say that they died at 3 years (as this is simply not the case) and it would be incorrect to say that they have survived to the next time stamp (3 years and 1 week) as this has not been observed to be true yet. However, we still would like to make use of their time in the study, and not discard all their data - this is especially important in the medical field where patient data can be scarce. So therefore, after 3 years, we censor them - i.e. they neither count for being alive nor for being dead. Graphing this generates what is knowm as a Kaplan Meier Survival Curve. Right-censoring does mean that over time, the results of the Kaplan Meier survival curve get less accurate, however it still allows us to get some information out of the partial data.
This program does just this. It was written for use at the Edinburgh Cancer Centre, as the previously available software in place was both expensive and difficult for staff to use as it did much more than just calculate these survival curves.
It is written in Python and can calculate and display the survival curves for an arbitrary number of groups of patients in the same dataset, while correctly taking into account right-censoring of data.